January 21, 2022
Estimate Bias
—A Look at Error in Estimates
I’ve been spending a lot of time on project management lately. Most of the focus is on building plans that achieve consistent delivery and known quality. I say consistent delivery because this implies predictable outcomes.
I differentiate between consistent and optimal delivery–that’s an argument similar to learning how to walk before you run. I’m just discussing walking.
One way of developing consistent delivery is to add buffer your schedules. It’s not good practice to buffer arbitrarily. Buffer should reflect factual information about the project you are running.
If I buffer, I do so transparently. This allows people to challenge the buffer.
This post is about an element of buffer I’ll call estimate bias. Estimate bias is the ratio of the sum of time spent to the sum of original estimate for a similar project. A similar project, ideally uses the same people, code base, technology and tools.
The estimate bias is a multipler for estimates on the new project–if the bias is 2 and the estimate is 5, then I create a loaded estimate of 10. It adds a lot of time to a project.
Why do I create a bias?
I love arguments about creating accurate estimates. An estimate is just a guess. A highly educated guess, but a guess nonetheless. Bias is a measure of error in estimates.
I’ve written elsewhere about no estimates. I’d liken bias to a heuristic that is part of the balance between no estimates and a prediction for a completion time. I use it in an environment firmly embeded in cost vs time.
Let’s get back to the bias: the sum of time spent divided by the sum of original estimate. I’ve struggled with this definition. I’ve settled on the notion that this is best expressed as the number of units of time spent for each unit of the original estimate.
I’ve had some people suggest this is a work ratio (time spent divided by original estimate). It is not. I agree that work ratio is a valid measure for a single task, but it’s not a good measure to apply to an entire project.
To use work ratio, you’d have to use an average of ratios. Take a momement to look at these plots of data.
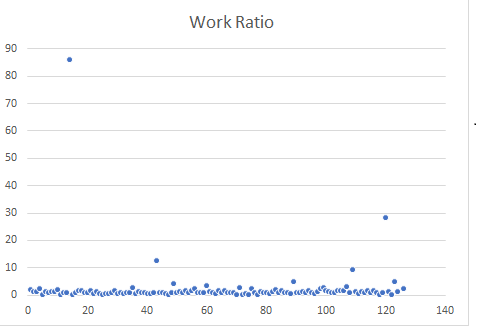
In this example, the outliers need to remain (because they reflect real events). There needs to be a balanced way to manage the outliers with the majority of events. The average of ratios is too sensitive to outliers.
A geometric mean doesn’t seem appropriate because the relationship between time spent on different tickets is not multiplicative. It’s additive.
This leaves a weighted average and the definition I describe above. The problem with the weighted average is what is a sensible weight to provide to the ratio of 86 on this graph? I don’t even want to think about that.
Let me describe why I think that sum of time spent divided by the sum of original estimate is a resonable heuristic. Let’s say I have two tasks as follows.
| Ticket | Time Spent | Original Estimate | Work Ratio |
|---|---|---|---|
| T1 | 1 | 1000 | 0.001 |
| T2 | 1000 | 1 | 1000 |
| Total | 1001 | 1001 | 500.0005 |
This looks like a scary project but it ended on time. An average of ratios would have me cost this project at 500.05 units of time when in fact it cost exactly what was predicted. Bias would be 1 which accurately reflects the error in the estimate for the project. (Clearly we have a problem estimating, but that’s a ticket level problem that the work ratio correctly identifies.)
Is bias a good idea? It is if the project, team and resources are similar. Similarity is of course an open question.
