April 29, 2020
Data Measurement and Analysis for Software Engineers
—A look at measurement and its application in software engineering.
This post is motivated by a series of SIGSOFT webinars by Dennis J. Frailey entitled Fundamentals of Measurement and Data Analysis for Software Engineers. Part I lays out the foundation of measurement theory for software engineering. The first webinar includes a field chart for scales and permitted operations. It’s worth the price of admission.
The ultimate goal for software metrics is to help software professionals … make decisions under uncertainty.
Why do we measure? To make things more visible and controllable. Better information leads to more informed decision making. The key is proper selection, collection, analysis and interpretation of metrics.
In discussing the analysis and interpretation, Frailey references a paper by Stanley S. Stevens entitled On the Theory of Scales of Measurement. This paper weighs in at 3 pages and tells a story of the challeges in creating a definition of measurement. They arrived at
measurement is the assignment of numerals to objects or events according to rules.
The paper sets out to make explicit
- the rules for assigning numerals,
- the mathematical properties of the resulting scales and
- the statistical operations permitted on each scale.
Misunderstanding scales and the statistical analysis on measures in those scales leads to poor decisions.
Frailey refines the definition of measurement using Fenton’s definition:
Measurement is
… the process by which
numbers or symbols
are assigned to
attributes of entities in the real world
in such a way so as to
describe them acording to clearly defined rules.
Importantly,
The assignment of numbers must preserve the intuitive and empirical observations about the attributes and entities.
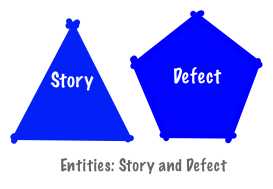
Entities, Attributes and Values of Attributes
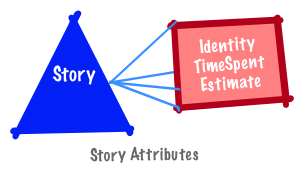
Attributes are features, properties or characteristics that allow us to distinguish entities from each other or compare and evaluate entities.
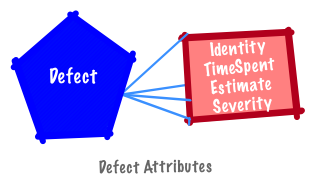
Attributes are often measured by numbers or symbols–numbers don’t always make sense. They permit distinguishing entities or comparing them. An attribute is a property or characteristic of an entity that can distinguish them quantitatively or qualitatively.
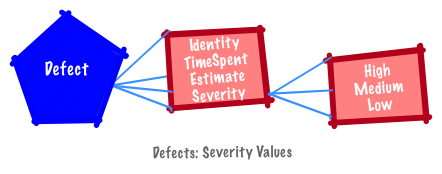
A defect identifier is best represented as a unique symbol (e.g., BUG-1). An estimate and time spent on a defect is represented as a unit of time; severity is a category (e.g., High (H) and Low (L)).
Basic Rules and Principles
Measures should lead to useful information–you should have a purpose for every measure. Alternatively, don’t collect measures if you don’t know how they will be consumed. It’s pointless and distracting.
A consistent set of rules can indicate the type of measurement results. In most cases, formulation of the rules of assignment determines the nature of the scale. If there is any ambiguity the group formed by the scale–and the what ways it be transformed and still serve it’s function? Measurement is never better than the empirical operations by which it is carried out.
If our product backlog comprises stories and defects it is meaningful to count them within their respective categories. It is meaningful to count the defects attributed to a story.
Comparing stories to defects is meaningless unless a comparison can be made with time spent or estimates. Since stories lack a severity attribute they are different from defects. This difference prevents direct comparison.
Good measures rely upon a model that reflects a specific viewpoint.
- What we are going to measure?
- What attribute are we collecting data on?
Identifying what to measure is the subject of The Goal/Question/Metric (GQM) Paradigm. It is also the realm of the scientific method.
A measure is a variable to which a value is assigned as a result of measurement. Data is a collection of values assigned to measures. Identifying how to measure something lies in the realm of measurement theory.
Measurement theory differentiates between base and derived or calculated measures.
-
A base measure or direct measure is a direct quantification of an attribute. It is generated through observation of the thing being measured (e.g., time spent on a story or defect).
-
A calculated or derived measure is a measure defined in terms of other measures. They are new measures defined in terms of base measures (e.g., the average number of hours spent on defects).
Measurement involves the assignment of numbers to attributes of the entities being observed. That assignment determines how the entity is classified and what statistical operations have meaning on that object. The analysis of measures requires understanding the scales of measurement.
Scales of Measurement
A scale of measure is also known as a level. They help us understand what we are seeing.
A scale is a collection of symbols or numbers used to classify attributes of entities. It is a system for describing the nature of information.
Different scales have different properties. Those properties determine which forms of analysis are appropriate on them.
Stevens classifies scales into the following groups.
- nominal
- ordinal
- interval
- ratio
The further down this list the more sophisticated analysis you can perform.
Nominal Scale
Nominal scale enables categorization but does not support ordering. In these scales, numbers and symbols are used only as labels. For example, colour and a football jersey number used to identify a player are both nominal scales. (Colour has a natural order if you look at wavelength, but let’s ignore this for purposes of this example.).
You can count the size or frequency (mode) of each category. There is no average or a median nor is there a natural category ordering.
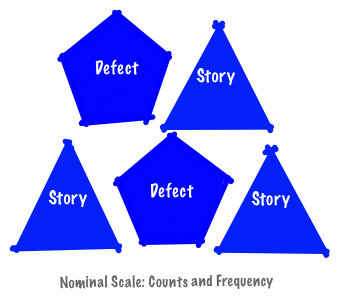
In a nominal scale you can easily count stories and defects and identify individual objects using the identifier. There is no way to determine which story should be ordered before another.
You can use numbers to categorize a nominal scale but there is no numerical meaning. Changing the shape assigned to stories does not change the scale. Likewise changing the label “Story” does not change the scale-there are still three objects in the category.
In a nominal scale, do not assign the same numeral or symbol to different categories or different numerals and symbols to the same category. For example, Story and Defect are assigned different shape to differentiate them. If they had been assigned the same shape they would be indistinguishable from each other.
Ordinal Scale
Ordinal scales enable ranking or ordering the data. For example, the serverity of defects are often ordered as high, medium and low, so defects can be ranked by severity.
Items in an ordinal scale can be sorted. This permits the middle item to be identified. Ordinal items do not support the notion of average (and hence standard deviation). There is no mathematical relationship between ordinal values–the degree of distance between categories is not defined.
Stevens says that averages and standard deviations computed on ordinals are in error to the extent that successive intervals on the scale are unequal. Percentages are dangerous if interpolating linearity within a class interval. Likewise, interpolating the mid-point in a class interval using linear interpolation is dangerous because linearity in an ordinal scale is an open question.
Interval Scale
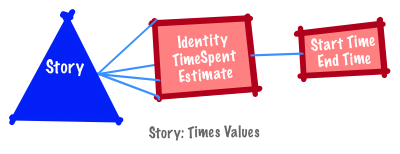
Interval scales are ordered and there is a fixed distance between consequtive members. Examples include dates, times and temperatures.
Given any two dates (times or temperatures), you can count the number of intervals between any two points on the scale. You can add or substract values, order them and calculate the distance between any two of them. You cannot multiply or divide or calculate a ratio. There is no true zero (e.g., when time began).
Computing ratios of intervals is a common error–so a ratio of the time start of two stories or the start and end times for a story is meaningless. You can compute ratios between differences. It is fine to say the ratio of time spent on two different stories is double or half of the other.
The zero point on an interval scale is usually a matter of convenience (e.g., Centigrade and Fahrenheit temperatures in comparison with Kelvin).
Ratio Scale
Ratio scales support multiplication and division. They support equality, rank-ordering, equality or intervals and equality of ratios. There is a true zero. They are commonly encountered in physics.
An example of a ratio scale is speed.

Ratio scales are either fundamental or derived. A fundamental scale measures a true value (e.g., speed). A derived scale is a function of one or more values from a fundamental scale (e.g., acceleration) All types of statistical measures are applicable. You can compute an average or mean (and thus standard deviation).
Absolute Scale
An absolute scale is a scale where all mathematical operations (e.g., average and exponentiation) are meaningful. It is a system of measurement that begins at a minimum, or zero point, and progresses in only one direction.
Pressure, length, area and volume are all measured using an absolute scale.
Sample Size
Suppose you have a large number of entities. How many are needed to make a predictions about them? Sample size is the number of entities to measure in ensure meaningful predictions.
To determine a the sample size, how many entities needs to be understood. The total number of entities is the population.
To make meaningful predictions the proportion of sample size relative to the population count is needed. Sampling data includes margin of error and sample size. Sample size depends upon the circumstances (what is the size of your sample as a percentage of total, how well have you selected your sample)?
A sample size of 1% is less useful than one representing 10% or 20% of the population. Need to consider what proportion of the population is included in the sample size–the larger the sample size the better.
Resources
Some of these resources make me wonder if some of the learning in psychology on creating measures is applicable to software metrics. Not thinking Likert but more about methodology and identification.
This thinking contradicts a little of what On the Application of Measurement Theory in Software Engineering says, but not entirely. An interesting question when posed in the context of some discussion in Statistics and the Theory of Measurement and Measurement Theory with Applications to Decisionmaking, Utility, and the Social Sciences.
Suppes thought through measurement on many different levels. Methodology, Probability and Measurement. A great resource but a hard read.
